Machine-Learning
Machine Learning(Classification)
by 나다경
1. 분류모델 기초
1.1 사이킷런과 머신러닝
사이킷런 : 대표적인 파이썬 머신러닝 라이브러리
분류, 회귀 모델 주로 사용
-
Classification (분류)
: Identifying which category an object belongs to.
-
Regression (회귀)
: Predicting a continuous-valued attribute associated with an object.
ML
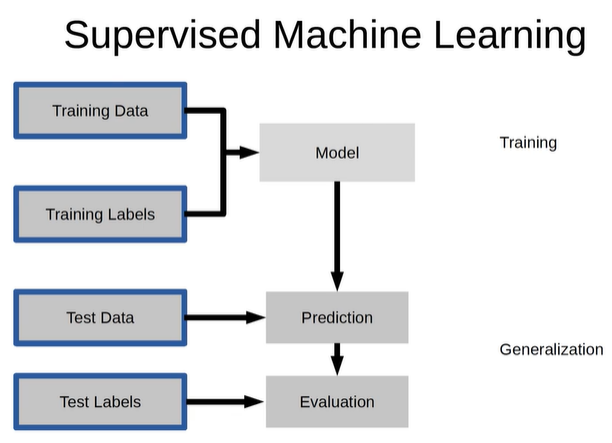
- Supervised learning : 지도학습, 정답 O

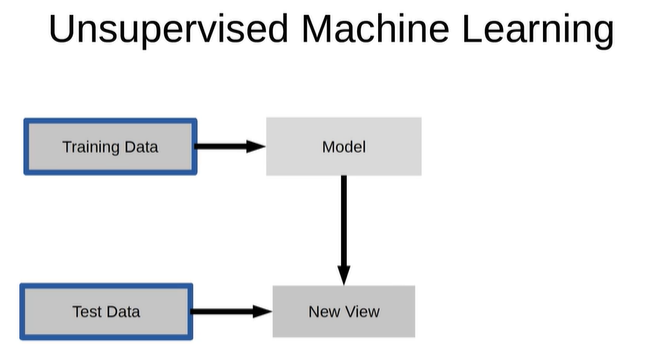
- UnSupervised learning : 비지도 학습, 정답 X

1.2 의사결정나무로 간단한 분류 예측 모델 만들기
1.2.1 데이터 구성
- Pregnancies : 임신 횟수
- Glucose : 2시간 동안의 경구 포도당 내성 검사에서 혈장 포도당 농도
- BloodPressure : 이완기 혈압 (mm Hg)
- SkinThickness : 삼두근 피부 주름 두께 (mm), 체지방을 추정하는데 사용되는 값
- Insulin : 2시간 혈청 인슐린 (mu U / ml)
- BMI : 체질량 지수 (체중kg / 키(m)^2)
- DiabetesPedigreeFunction : 당뇨병 혈통 기능
- Age : 나이
- Outcome : 768개 중에 268개의 결과 클래스 변수(0 또는 1)는 1이고 나머지는 0
1.2.2. 필요한 라이브러리 로드
import pandas as pd
import numpy as np
import seaborn as sns
import matplotlib.pyplot as plt

%matplotlib inline
1.2.3. 데이터셋 로드
df = pd.read_csv('diabetes.csv')
df.shape  #(768,9)
df.head()

1.2.4. 학습, 예측 데이터셋 나누기
데이터셋을 학습 세트와 예측 세트로 나눠줘야 함
# 8:2의 비율로 구하기 위해 전체 데이터의 행에서 80% 위치에 해당되는 값을 구해서 split_count라는 변수에 담음
split_count = int(df.shape[0]*0.8)
split_count   #614
df.shape는 튜플로 데이터를 가져오고, [0]이라는 인덱싱을 하면 df의 행의 갯수를 출력함
여기서 나온 행의 갯수의 80%만 가져오는 연산을 하여 int()함수를 이용해 정수로 떨어지게 함
train = df[:split_count].copy()
train.shape   #(614,9)
test = df[split_count:].copy()
test.shape   #(154,9)
train에는 0번째 행부터 split_count번째 전까지 슬라이싱 한 행들을, test에는 split_count부터 끝 행까지 슬라이싱을 함
1.2.5. 학습, 예측에 사용할 컬럼
feature_names = train.columns[:-1].tolist()
feature_names
#['Pregnancies','Glucose','BloodPressure','SkinThickness','Insulin','BMI','DiabetesPedigreeFunction','Age']
처음부터 마지막에서 두번째 열까지를 지정함
1.2.6. 정답값이자 예측해야 될 값
label_name = train.columns[-1]
label_name   #'Outcome'
Outcome 1개를 string 형태로 지정함
1.2.7. 학습, 예측 데이터셋 만들기
# 학습 세트 만들기 e.g) 시험의 기출문제
X_train = train[feature_names]
print(X_train.shape)
X_train.head()   #(614,8)

# 정답 값 만들기 e.g) 기출문제의 정답
y_train = train[label_name]
print(y_train.shape)
y_train.head()   #(614,)
# 예측에 사용할 데이터세트 만들기 e.g) 실전 시험 문제
X_test = test[feature_names]
print(X_test.shape)
X_test.head()   #(154,8)
# 예측의 정답값 e.g) 실전 시험 문제의 정답
y_test = test[label_name]
print(y_test.shape)
y_test.head()   #(154,)
1.2.8 머신러닝 알고리즘 가져오기
from sklearn.tree import DecisionTreeClassifier

model = DecisionTreeClassifier(random_state=42)
model
1.2.9 학습(훈련)
- 시험을 볼 때 기출문제(X_train)와 기출문제 정답(y_train)을 보고 공부하는 과정과 유사
model.fit(X_train, y_train)
1.2.10 예측
- 실전 시험문제(X_test)라고 보면 됨. 우리가 정답을 직접 예측함
- 정답열을 넣지 않고, 풀어야 할 문제열만 넣어줌
y_predict = model.predict(X_test)
y_predict[:5]   #array([1, 0, 1, 0, 1], dtype=int64)
1.2.11 트리 알고리즘 분석하기
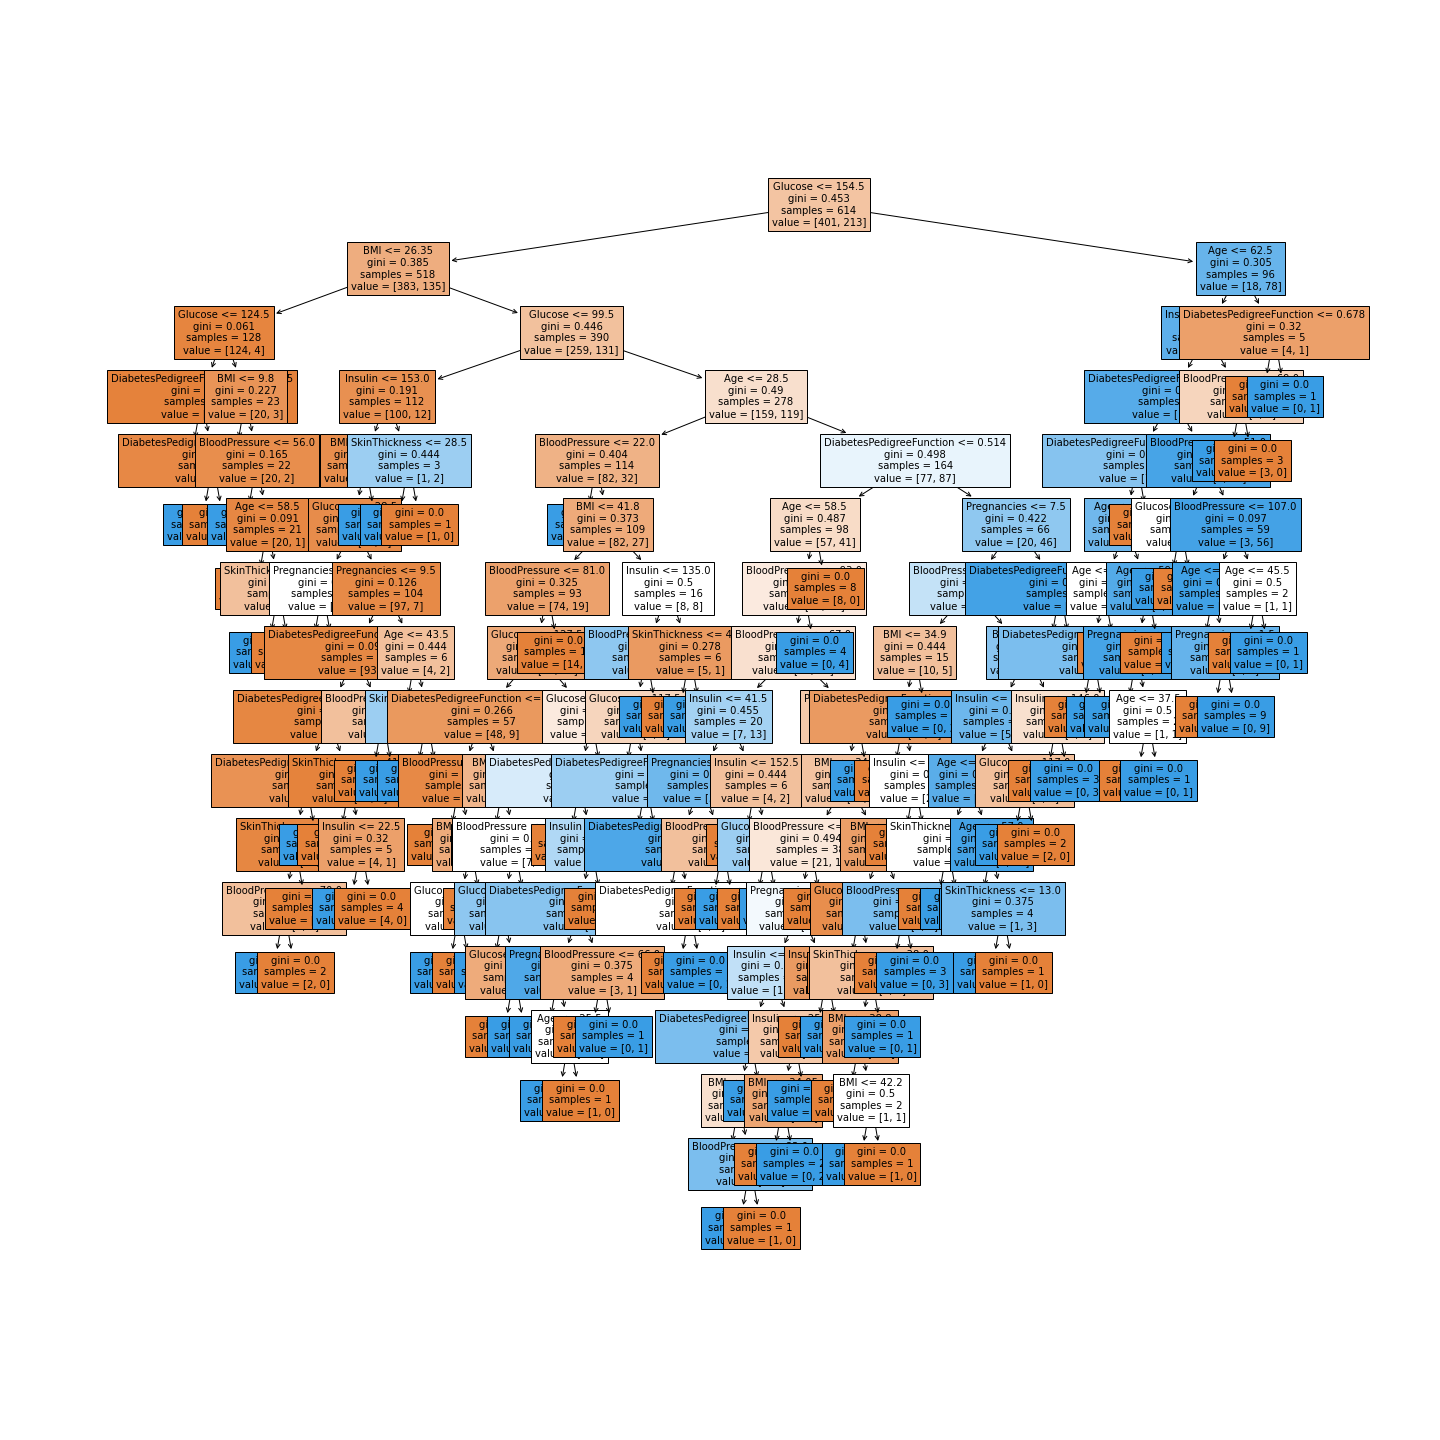
- 의사결정나무를 시각화 함
from sklearn.tree import plot_tree

plt.figure(figsize=(20,20))
tree = plot_tree(model,
         feature_names=feature_names,
                filled = True,
                fontsize=10)

시각화 결과 글루코스, BMI 등으로 tree의 가지가 나눠지기 시작함
밑으로 내려갈수록 샘플의 수가 적어짐
# 피처의 중요도 추출하기
model.feature_importances_
#array([0.05944171, 0.30368248, 0.13140431, 0.04020035, 0.09010707,0.15739296, 0.12077948, 0.09699165])
# 피처의 중요도 시각화하기
sns.barplot(x=model.feature_importances_, y=feature_names)

1.2.11 정확도(Accuracy) 측정하기
diff_count = abs(y_test - y_predict).sum()
diff_count   #44
실제값 - 예측값 --> 같은 값은 0으로 나옴
절대값을 씌운 값이 1인 값은 다르게 예측한 값이 됨
(len(y_test) - diff_count) / len(y_test) * 100 #71.428
예측의 정확도를 구함. 100점 만점 중에 몇 점을 맞았는지 구한다고 보면 됨
# 알고리즘 활용
from sklearn.metrics import accuracy_score
accuracy_score(y_test, y_predict) * 100   #71.428
# model의 score로 점수를 계산함
model.score(X_test, y_test) * 100   #71.428